
Project information
- Category: Personal Project
- Type: Biostatistics Data Visualization
Oura Ring Data Visualization
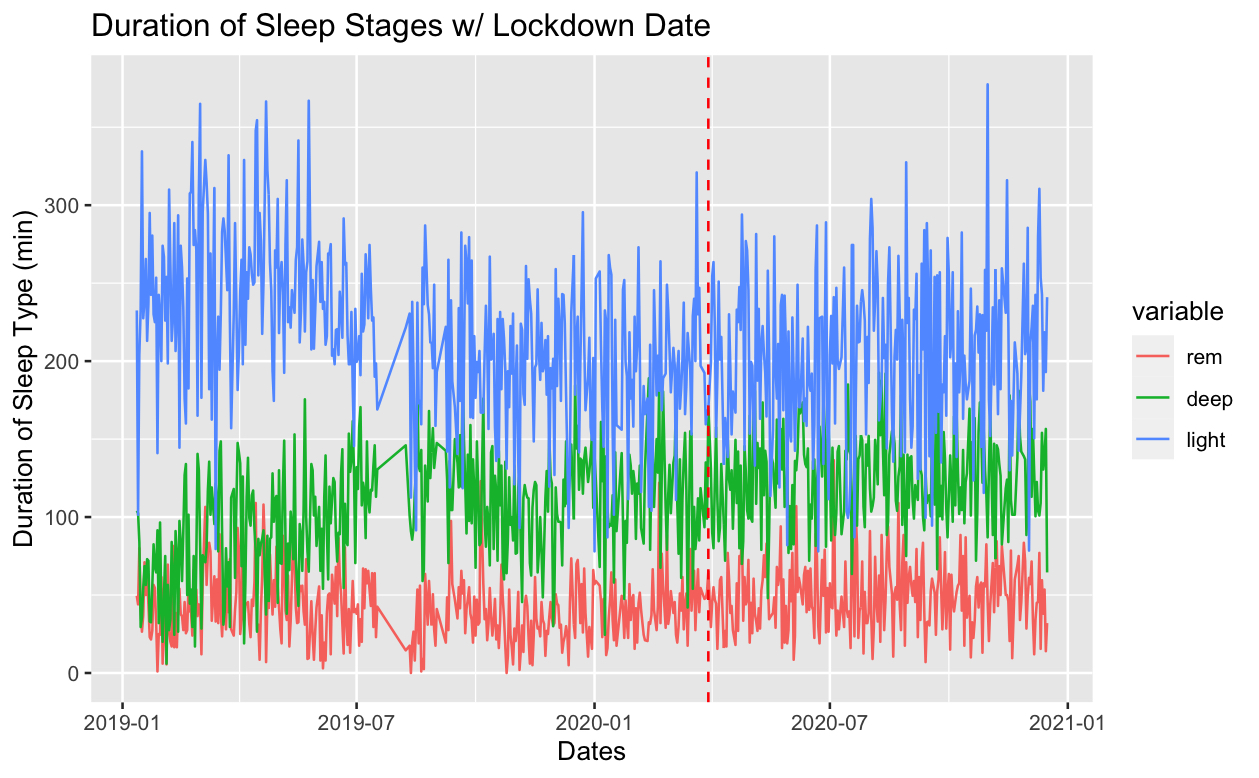
I have been wearing an Oura Ring health tracker since early 2019. Personally, I'm really interested in tracking various biometrics and Oura provides a lot of data to play with. Using RStudio I started playing around with some data visualization techniques. It's been interesting for me to note macro trends in my sleep and health! To explain, I started grad school in the fall of 2019 and had a difficult quarter beginning of 2020, which describes the dip in my data. Surprisingly, after shelter in place in late March 2020 my sleep score started to increase! This trend has been seen at scale and, personally, is associate with going out less and being able to sleep in a bit more considering my desk is only 10 feet from my bed.
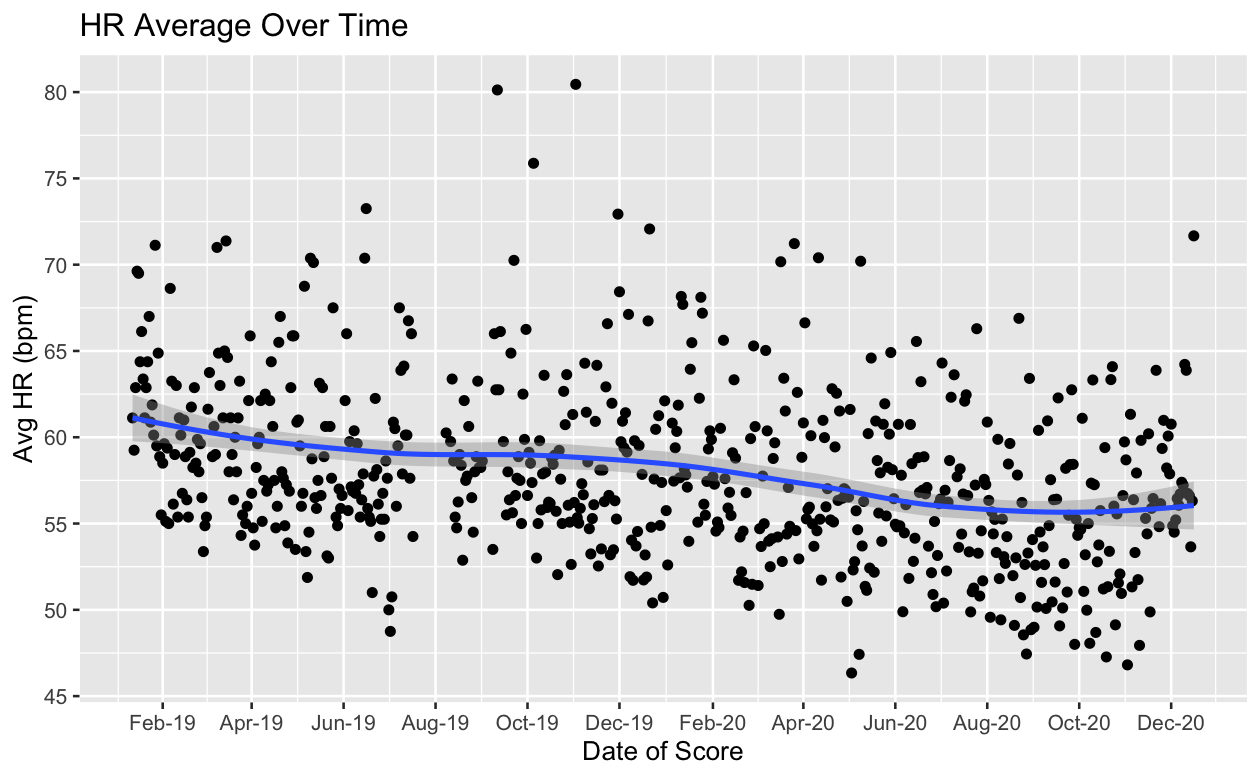
What else is interesting to me is my net decrease in resting heart rate. Overall, this is a positive sign of readiness and recovery. This appears to be correlated to levels of deep sleep. In the future, I plan developing CDA models to understand what factors are most driving my sleep quality!